
最近我们接手一个第三方开发的游戏运维,所有的安装文档和软件包及配置参数都是第三方提供的,其中数据库部分使用的MySQL官方开源版本5.5.20,配置文件也是第三方提供的,我们在部署第一个区服后,按自己使用MySQL5.1版本数据库的经验来初步优化MySQL数据库的配置文件my.cnf,其中主要是启用了innodb_file_per_table,并且修改innodb_flush_log_at_trx_commit的2改为0,然后将主机和MySQL纳入到Cacti的监控中,在运行第四天的时候,我们发现Cacti的监控上有一些差异,然后开始寻找原因…
1)硬件配置和相关参数设置
CPU:2*5630(16 core)
MEM:16GB
HDD:2*15k 300GB sas RAID1 (IO太差了…)
innodb_change_buffering=all
innodb_buffer_pool_size=2G
应用环境:python 短连接
2)数据库物理文件大小和mysqldump逻辑备份集大小
2.1)第一台主机(innodb_file_per_table=OFF,innodb_flush_log_at_trx_commit=2)
[mysql@ZS29 mysql]$ ll -h
-rw-rw—- 1 mysql mysql 970M Mar 27 17:24 ibdata1
ZS29_20120327.sql.bz2 52.9M
2.1)第二台主机(innodb_file_per_table=ON,innodb_flush_log_at_trx_commit=0)
[mysql@ZSAS mysql]$ du -sSh 19216819010/
1.2G 19216819010/
ZSAS_20120327.sql.bz2 46.9M
由上面数据我们可以看到共享表空间比独立表空间的存储效率高
3)转到正题说innodb_change_buffering这个参数
官方文档解释连接如下:http://dev.mysql.com/doc/refman/5.5/en/innodb-parameters.html#sysvar_innodb_change_buffering
更详细的信息在这里:http://dev.mysql.com/doc/refman/5.5/en/innodb-performance-change_buffering.html
4)看我Cacti的监控图
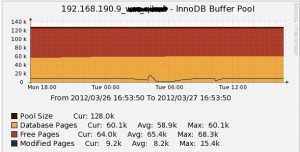
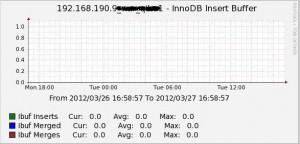
4.1)第一台主机
4.1)第二台主机
22日启用该数据库
26日的凌晨4点做mysqldump –single-transaction全备,发现ibuf cell count从2增加到94
27日凌晨4点全备时候ibuf cell count从94增加到218
但是ibuf used cell最大使用是1(Y?),对ibuf cell count统计原理不清楚
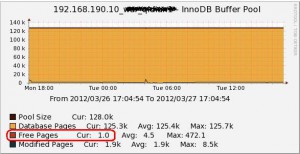

innodb buffer pool的监控上看到,第一台主机970MB的物理文件使用了1GB的BP,第二台主机上1.2GB的物理文件将2GB的BP都使用完
innodb_insert buffer usage的监控图上看到。第一台主机的ibuf使用为0,第二台主机使用ibuf信息如图上方蓝色斜体字所示
5)下面是两台主机的show engine innodb statusG的输出
5.1)第一台主机
mysql> show engine innodb statusG
*************************** 1. row ***************************
Type: InnoDB
Name:
Status:
=====================================
120326 14:21:50 INNODB MONITOR OUTPUT
=====================================
Per second averages calculated from the last 46 seconds
—————–
BACKGROUND THREAD
—————–
srv_master_thread loops: 666042 1_second, 666037 sleeps, 65599 10_second, 10428 background, 10428 flush
srv_master_thread log flush and writes: 669932
———-
SEMAPHORES
———-
OS WAIT ARRAY INFO: reservation count 364363, signal count 1993532
Mutex spin waits 22249903, rounds 64715401, OS waits 253896
RW-shared spins 312039, rounds 2368779, OS waits 70939
RW-excl spins 598499, rounds 3373436, OS waits 27594
Spin rounds per wait: 2.91 mutex, 7.59 RW-shared, 5.64 RW-excl
————
TRANSACTIONS
————
Trx id counter 130D68CA
Purge done for trx’s n:o < 130D5319 undo n:o < 0
History list length 2313
LIST OF TRANSACTIONS FOR EACH SESSION:
—TRANSACTION 130738AE, not started
MySQL thread id 267042058, OS thread handle 0×43147940, query id 1126874980 localhost root
show engine innodb status
——–
FILE I/O
——–
I/O thread 0 state: waiting for i/o request (insert buffer thread)
I/O thread 1 state: waiting for i/o request (log thread)
I/O thread 2 state: waiting for i/o request (read thread)
I/O thread 3 state: waiting for i/o request (read thread)
I/O thread 4 state: waiting for i/o request (read thread)
I/O thread 5 state: waiting for i/o request (read thread)
I/O thread 6 state: waiting for i/o request (read thread)
I/O thread 7 state: waiting for i/o request (read thread)
I/O thread 8 state: waiting for i/o request (read thread)
I/O thread 9 state: waiting for i/o request (read thread)
I/O thread 10 state: waiting for i/o request (write thread)
I/O thread 11 state: waiting for i/o request (write thread)
I/O thread 12 state: waiting for i/o request (write thread)
I/O thread 13 state: waiting for i/o request (write thread)
I/O thread 14 state: waiting for i/o request (write thread)
I/O thread 15 state: waiting for i/o request (write thread)
I/O thread 16 state: waiting for i/o request (write thread)
I/O thread 17 state: waiting for i/o request (write thread)
Pending normal aio reads: 0 [0, 0, 0, 0, 0, 0, 0, 0] , aio writes: 0 [0, 0, 0, 0, 0, 0, 0, 0] ,
ibuf aio reads: 0, log i/o’s: 0, sync i/o’s: 0
Pending flushes (fsync) log: 0; buffer pool: 0
1391 OS file reads, 116655932 OS file writes, 1258228 OS fsyncs
0.00 reads/s, 0 avg bytes/read, 209.39 writes/s, 2.52 fsyncs/s
————————————-
INSERT BUFFER AND ADAPTIVE HASH INDEX
————————————-
Ibuf: size 1, free list len 0, seg size 2, 0 merges
merged operations:
insert 0, delete mark 0, delete 0
discarded operations:
insert 0, delete mark 0, delete 0
Hash table size 4425293, node heap has 3501 buffer(s)
1420.25 hash searches/s, 498.34 non-hash searches/s
—
LOG
—
Log sequence number 41254406127
Log flushed up to 41254372111
Last checkpoint at 40870741452
0 pending log writes, 0 pending chkp writes
115271637 log i/o’s done, 206.80 log i/o’s/second
———————-
BUFFER POOL AND MEMORY
———————-
Total memory allocated 2197815296; in additional pool allocated 0
Dictionary memory allocated 467977
Buffer pool size 131072
Free buffers 70823
Database pages 56748
Old database pages 20927
Modified db pages 9187
Pending reads 0
Pending writes: LRU 0, flush list 0, single page 0
Pages made young 3278, not young 0
0.00 youngs/s, 0.00 non-youngs/s
Pages read 0, created 56748, written 2032679
0.00 reads/s, 0.02 creates/s, 2.85 writes/s
Buffer pool hit rate 1000 / 1000, young-making rate 0 / 1000 not 0 / 1000
Pages read ahead 0.00/s, evicted without access 0.00/s, Random read ahead 0.00/s
LRU len: 56748, unzip_LRU len: 0
I/O sum[0]:cur[0], unzip sum[0]:cur[0]
————–
ROW OPERATIONS
————–
0 queries inside InnoDB, 0 queries in queue
1 read views open inside InnoDB
Main thread process no. 20434, id 1102543168, state: sleeping
Number of rows inserted 23525784, updated 52408224, deleted 19612589, read 10413217446
7.39 inserts/s, 95.72 updates/s, 0.61 deletes/s, 12916.57 reads/s
—————————-
END OF INNODB MONITOR OUTPUT
============================
5.1)第二台主机
mysql> show engine innodb statusG
*************************** 1. row ***************************
Type: InnoDB
Name:
Status:
=====================================
120326 14:21:43 INNODB MONITOR OUTPUT
=====================================
Per second averages calculated from the last 32 seconds
—————–
BACKGROUND THREAD
—————–
srv_master_thread loops: 453194 1_second, 453193 sleeps, 45105 10_second, 2270 background, 2270 flush
srv_master_thread log flush and writes: 477705
———-
SEMAPHORES
———-
OS WAIT ARRAY INFO: reservation count 251972, signal count 608458
Mutex spin waits 15744080, rounds 41341479, OS waits 135480
RW-shared spins 126894, rounds 2003575, OS waits 61480
RW-excl spins 202240, rounds 2643686, OS waits 52335
Spin rounds per wait: 2.63 mutex, 15.79 RW-shared, 13.07 RW-excl
————
TRANSACTIONS
————
Trx id counter 10133D76
Purge done for trx’s n:o < 10133C95 undo n:o < 0
History list length 436
LIST OF TRANSACTIONS FOR EACH SESSION:
—TRANSACTION 100C5EF4, not started
MySQL thread id 227845139, OS thread handle 0x431d9940, query id 961453164 localhost root
show engine innodb status
——–
FILE I/O
——–
I/O thread 0 state: waiting for i/o request (insert buffer thread)
I/O thread 1 state: waiting for i/o request (log thread)
I/O thread 2 state: waiting for i/o request (read thread)
I/O thread 3 state: waiting for i/o request (read thread)
I/O thread 4 state: waiting for i/o request (read thread)
I/O thread 5 state: waiting for i/o request (read thread)
I/O thread 6 state: waiting for i/o request (read thread)
I/O thread 7 state: waiting for i/o request (read thread)
I/O thread 8 state: waiting for i/o request (read thread)
I/O thread 9 state: waiting for i/o request (read thread)
I/O thread 10 state: waiting for i/o request (write thread)
I/O thread 11 state: waiting for i/o request (write thread)
I/O thread 12 state: waiting for i/o request (write thread)
I/O thread 13 state: waiting for i/o request (write thread)
I/O thread 14 state: waiting for i/o request (write thread)
I/O thread 15 state: waiting for i/o request (write thread)
I/O thread 16 state: waiting for i/o request (write thread)
I/O thread 17 state: waiting for i/o request (write thread)
Pending normal aio reads: 0 [0, 0, 0, 0, 0, 0, 0, 0] , aio writes: 0 [0, 0, 0, 0, 0, 0, 0, 0] ,
ibuf aio reads: 0, log i/o’s: 0, sync i/o’s: 0
Pending flushes (fsync) log: 0; buffer pool: 0
6735 OS file reads, 4243052 OS file writes, 1326189 OS fsyncs
0.00 reads/s, 0 avg bytes/read, 9.91 writes/s, 3.00 fsyncs/s
————————————-
INSERT BUFFER AND ADAPTIVE HASH INDEX
————————————-
Ibuf: size 1, free list len 92, seg size 94, 291 merges
merged operations:
insert 153, delete mark 17373, delete 847
discarded operations:
insert 0, delete mark 0, delete 0
Hash table size 4425293, node heap has 2237 buffer(s)
2241.55 hash searches/s, 483.27 non-hash searches/s
—
LOG
—
Log sequence number 28380253874
Log flushed up to 28380214187
Last checkpoint at 28371487311
0 pending log writes, 0 pending chkp writes
633115 log i/o’s done, 1.19 log i/o’s/second
———————-
BUFFER POOL AND MEMORY
———————-
Total memory allocated 2197815296; in additional pool allocated 0
Dictionary memory allocated 468083
Buffer pool size 131072
Free buffers 1
Database pages 128834
Old database pages 47537
Modified db pages 1855
Pending reads 0
Pending writes: LRU 0, flush list 0, single page 0
Pages made young 12408, not young 0
0.00 youngs/s, 0.00 non-youngs/s
Pages read 12801, created 151850, written 9047108
0.00 reads/s, 0.09 creates/s, 20.75 writes/s
Buffer pool hit rate 1000 / 1000, young-making rate 0 / 1000 not 0 / 1000
Pages read ahead 0.00/s, evicted without access 0.00/s, Random read ahead 0.00/s
LRU len: 128834, unzip_LRU len: 0
I/O sum[1105]:cur[0], unzip sum[0]:cur[0]
————–
ROW OPERATIONS
————–
0 queries inside InnoDB, 0 queries in queue
1 read views open inside InnoDB
Main thread process no. 22780, id 1098328384, state: sleeping
Number of rows inserted 10605313, updated 40304471, deleted 8267591, read 4327802933
7.62 inserts/s, 111.34 updates/s, 0.75 deletes/s, 8497.20 reads/s
—————————-
END OF INNODB MONITOR OUTPUT
============================
从show engine innodb status(重点观察看蓝色标记部分)可以印证Cacti的监控是没有问题的
6)为了剔除innodb_flush_log_at_trx_commit参数的影响,我在第二台机器上在2小时内将innodb_flush_log_at_trx_commit设置为2,观察show engine innodb status的输出和Cacti的监控图,证明此参数只影响了innodb checkpoint age,监控图如下(左下方为第一台主机的,右下方为第二台主机的):
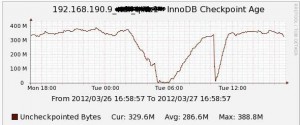

右上图红色标记的下降点是将innodb_flush_log_at_trx_commit从2修改为0的拐点
也印证下show engine innodb status的红色标记文字
总结:
从show engine innodb status上来看,MySQL5.5 innodb_change_buffering还是有优势的,做了多次的merges,并且没有使用的BP,很大部分用来做insert buffer buffer,从源代码里面可以看insert buffer buffer最大使用1/2 BP(忘记是5.1还是5.5版本),充分使用闲置的内存,但是确实没有想到和innodb_file_per_table参数也相关,查阅官方文档,也没看提到这两个参数相关的部分,有分析MySQL5.5源代码的同学可以分析分析下,谢谢.
下面是两台机器的show global variables输出对比:
更新:
1)备份时间是在2:20,第二台主机的ibuf两次突变是在4:00,与备份是没关系的
我们一直都在努力坚持原创.......请不要一声不吭,就悄悄拿走。
我原创,你原创,我们的内容世界才会更加精彩!
【所有原创内容版权均属TechTarget,欢迎大家转发分享。但未经授权,严禁任何媒体(平面媒体、网络媒体、自媒体等)以及微信公众号复制、转载、摘编或以其他方式进行使用。】
微信公众号

TechTarget
官方微博

TechTarget中国
作者
相关推荐
-
OpenWorld18大会:Ellison宣布数据库的搜寻和破坏任务
在旧金山举行的甲骨文OpenWorld 2018大会中,甲骨文首席技术官(CTO)兼创始人Larry Elli […]
-
ObjectRocket着力发展Azure MongoDB服务
MongoDB吸引了微软公司的注意力,微软公司计划针对运行于该公司2017年发布的Azure Cosmos D […]
-
数据库和数据仓库的区别在哪儿?
目前,大部分数据仓库还是用数据库进行管理。数据库是整个数据仓库环境的核心,是数据存放的地方和提供对数据检索的支持。
-
如何使用服务来平衡Oracle RAC 数据库工作负载
为不同的应用程序配置不同的服务,DBA可以更有效地平衡集群工作负载,在Oracle RAC数据库环境下实现更好的应用程序性能。